Which ETFs have the most Semiconductors exposure?
SOXX has the most Semiconductors exposure, at 99%. Funds holding any semiconductor company average 11%.
Updated November 18, 2026. Computed across all holdings, not the top 10.
Funds invested in semiconductor companies — chip designers, manufacturers, and chip equipment makers
The ETF Copilot Semiconductor List — 518 companies
Average 8%, benchmark VOO 14%, leader SOXX 99%
- 1,363 equity funds we track
- 879 hold any semiconductor company
- 146 are more than 20% semiconductors
- 9 are majority semiconductors
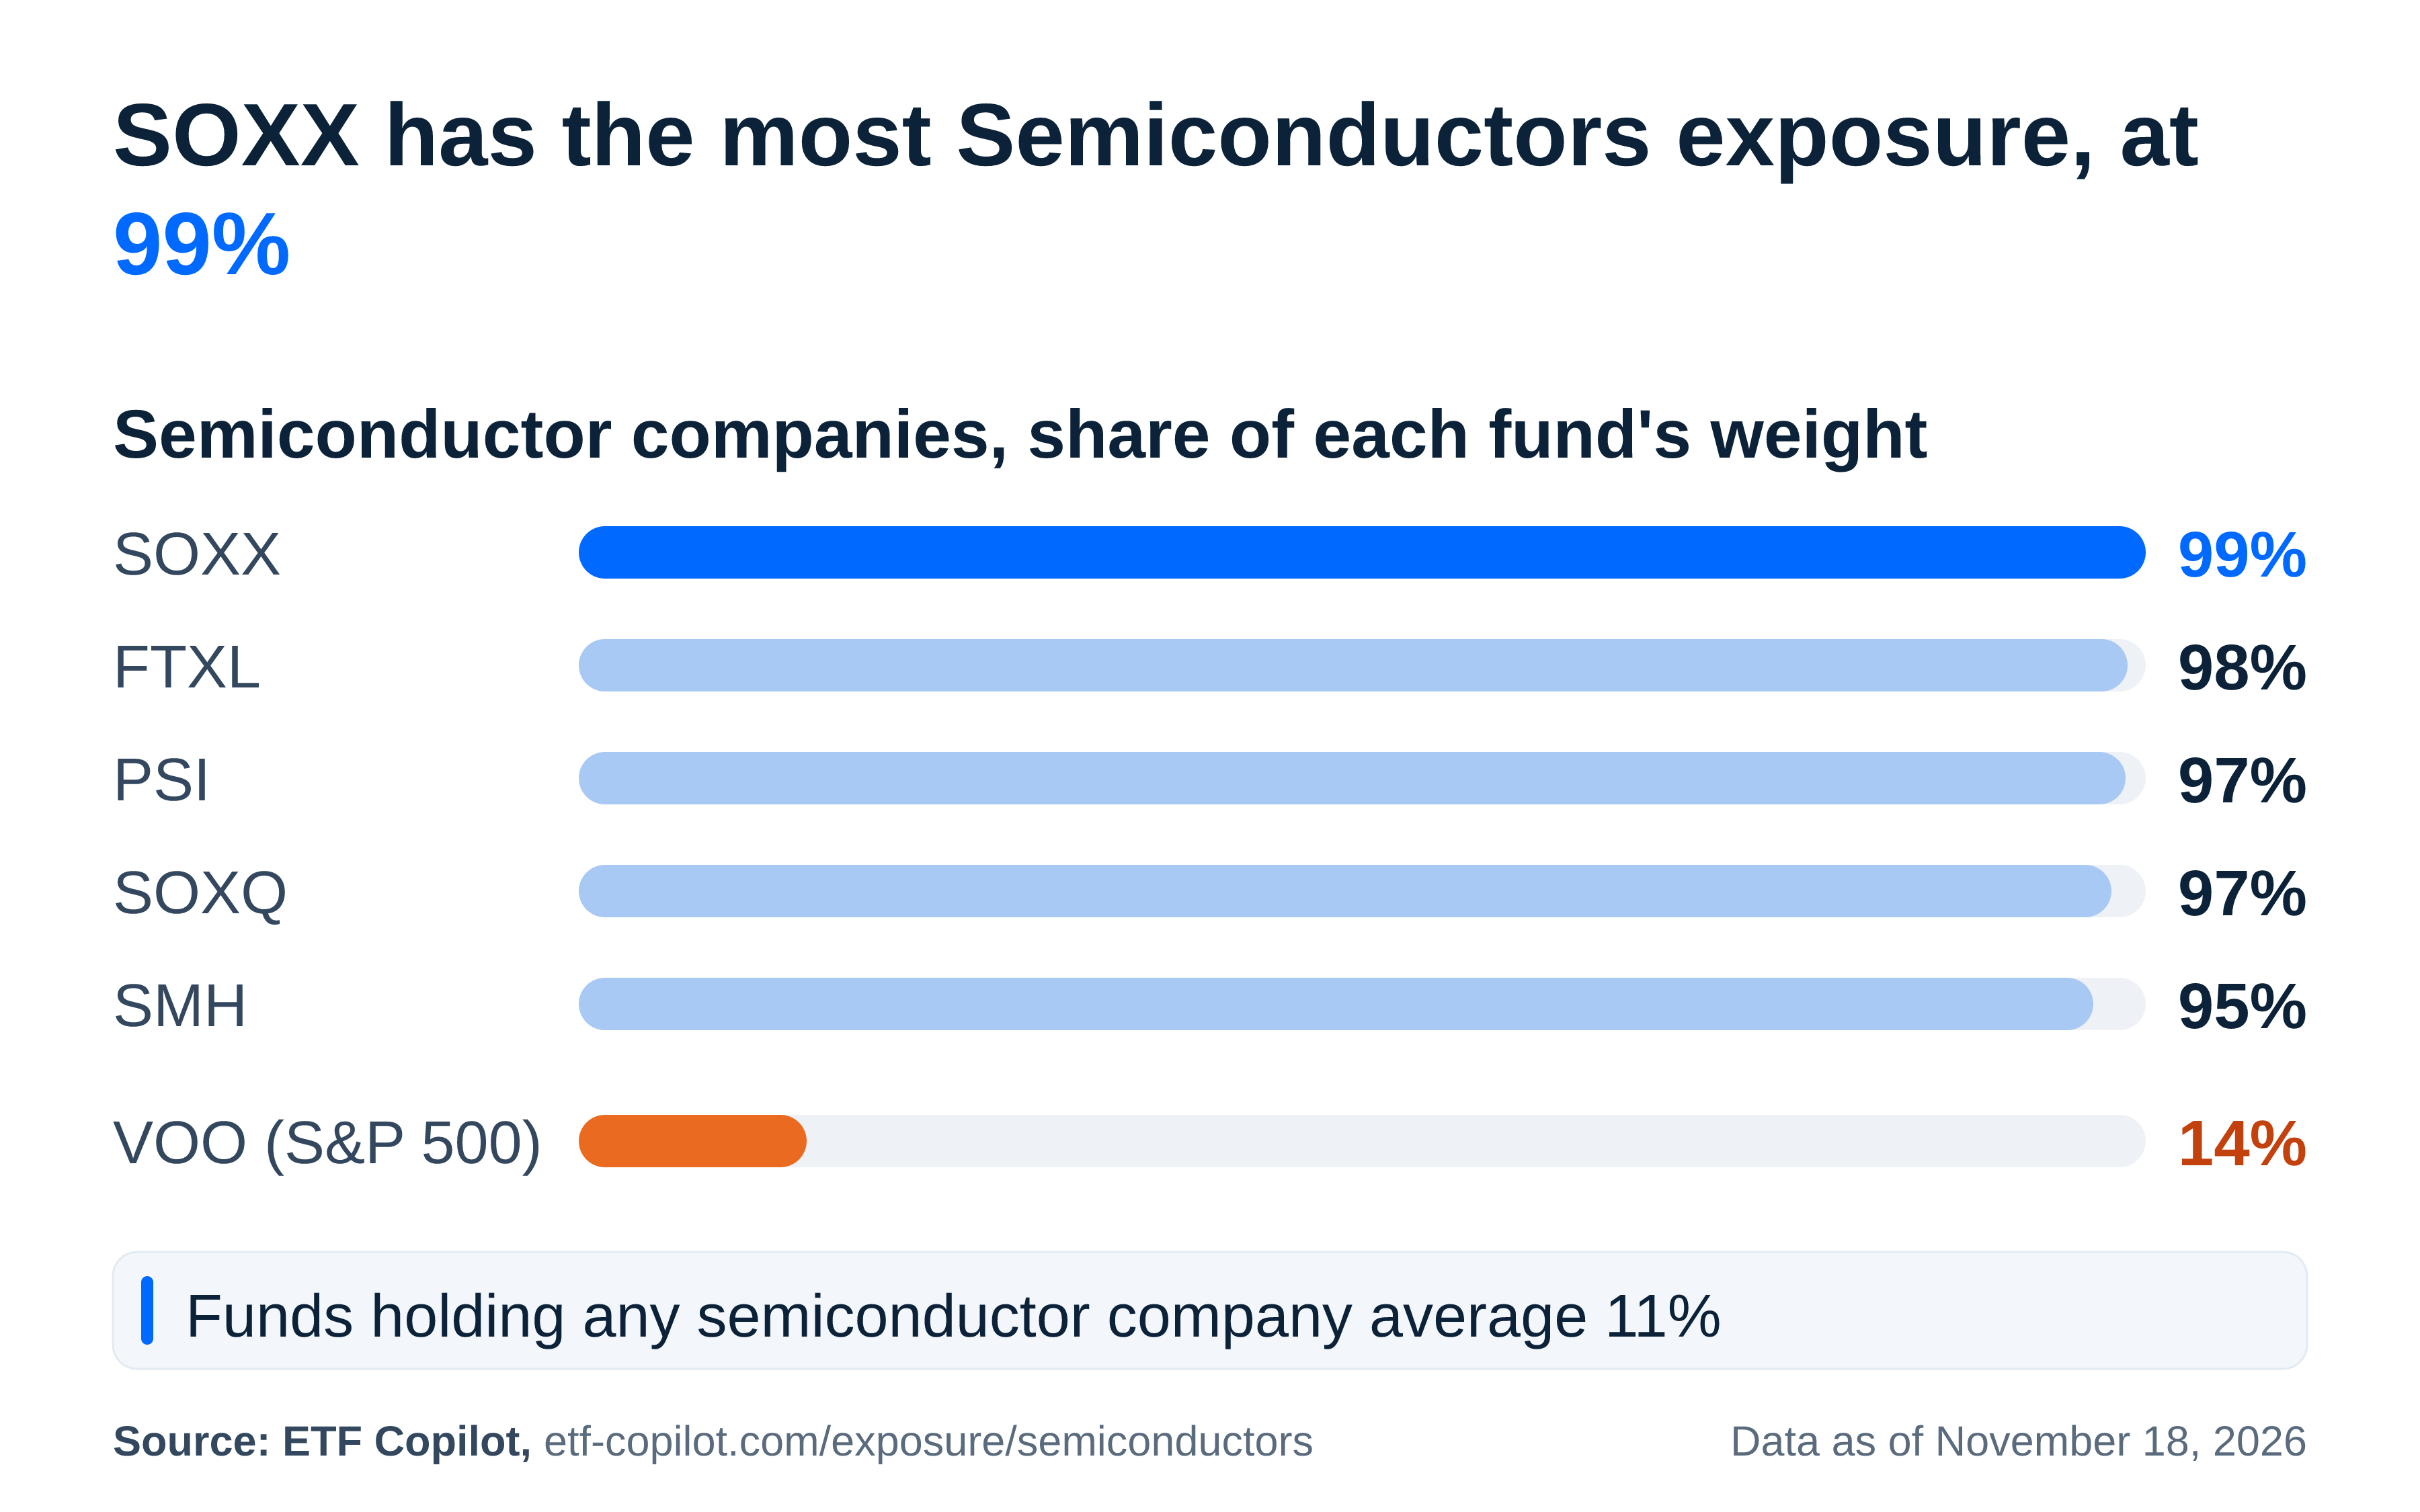
Where is Semiconductors exposure highest? SOXX, at 99%
| Fund | Semiconductors exposure | 1-year change |
|---|---|---|
| iShares Semiconductor ETF (SOXX) | 99% | +0.8 |
| First Trust Nasdaq Semiconductor ETF (FTXL) | 98% | +0.9 |
| Invesco Semiconductors ETF (PSI) | 97% | +8.5 |
| Invesco PHLX Semiconductor ETF (SOXQ) | 97% | -0.4 |
| VanEck Semiconductor ETF (SMH) | 95% | +0.2 |
| Strive U.S. Semiconductor ETF (SHOC) | 94% | +1.1 |
| Xtrackers Semiconductor Select Equity ETF (CHPS) | 90% | -3.3 |
| State Street SPDR S&P Semiconductor ETF (XSD) | 86% | -0.4 |
| Pacer Data and Digital Revolution ETF (TRFK) | 53% | +16.0 |
| Columbia Select Technology ETF (SEMI) | 47% | +0.1 |
Where is Semiconductors exposure lowest among diversified funds? BAMD, at 0%
| Fund | Semiconductors exposure | 1-year change |
|---|---|---|
| Brookstone Dividend Stock ETF (BAMD) | 0% | +0.0 |
| WisdomTree True Emerging Markets Fund (XC) | under 1% | +0.1 |
| Carbon Collective Climate Solutions U.S. Equity ETF (CCSO) | under 1% | -0.1 |
| Invesco International BuyBack Achievers ETF (IPKW) | under 1% | +0.0 |
| WisdomTree Global High Dividend Fund (DEW) | under 1% | -1.0 |
| WisdomTree International High Dividend Fund (DTH) | under 1% | -0.3 |
| KraneShares CSI China Internet ETF (KWEB) | under 1% | +0.2 |
| Xtrackers FTSE Developed ex US Multifactor ETF (DEEF) | under 1% | -0.2 |
| Dimensional International Small Cap Value ETF (DISV) | under 1% | -0.6 |
| iShares MSCI EAFE Value ETF (EFV) | under 1% | -0.3 |
Which categories carry the most Semiconductors exposure? Tech - Semiconductors, at 89%
- Tech - Semiconductors — 89%
- Tech - Hardware / Devices / Deep Tech — 29%
- US Large Cap Growth — 20%
- Thematic - Tech Disruption — 18%
- Emerging Markets — 17%
- Options Income (Covered Call / EPI) — 14%
- ESG — 13%
- US Large Cap Blend — 13%
- Tactical / Trend / Managed Futures — 11%
- US Total Market — 11%
- Global Large Cap — 10%
- Single Factor - Momentum & Other — 10%
- Asia Pacific — 9%
- Communications — 6%
- Weight - Equal — 6%
- Dividend US — 6%
- Weight - Multi-factor — 5%
- Tech - Software / Cloud / Cyber / AI — 5%
- Single Factor - Value & Dividend — 5%
- Single Factor - Quality & Low Volatility — 5%
- Japan — 5%
- Developed ex-US — 5%
- Dividend Global ex-US — 5%
- Weight - Fundamental — 4%
- Non-equity — 4%
- China — 3%
- US Mid Cap — 3%
- Clean Energy — 3%
- Europe — 3%
- US Large Cap Value — 3%
- Crypto — 2%
- US Small Cap — 2%
- Real Estate & Infrastructure — under 1%
- Commodities & Metals — under 1%
- Industrials & Materials — under 1%
- Consumer — 0%
- Energy — 0%
- Financials — 0%
- Frontier Markets — 0%
- Healthcare & Biotech — 0%
- Latin America — 0%
- Thematic - Real Assets — 0%
- Utilities — 0%
Cite this
ETF Copilot, “Semiconductors look-through exposure across 1,363 US equity ETFs”, as of November 18, 2026.
https://etf-copilot.com/exposure/semiconductors